
Ripple struggled to clear the $0.550 resistance against the US Dollar. XRP price is now moving lower and might drop further similar to bitcoin.
This past week, ripple’s XRP started a steady increase from the $0.4500 support zone. There was a clear move above the $0.480 and $0.505 resistance levels.
The price climbed above the $0.520 resistance, outperforming bitcoin and ethereum’s ether. However, the bulls failed once again to clear the key $0.550 resistance zone. A high was formed near $0.5486 and the price started a fresh decline.
XRP price declined below the $0.52 and $0.50 support levels. There was a move below the 50% Fib retracement level of the upward move from the $0.4417 swing low to $0.5486 high.
Besides, there was a break below a key bullish trend line with support near $0.4940 on the 4-hours chart of the XRP/USD pair. The price is now trading below $0.500 and the 100 simple moving average (4-hours).’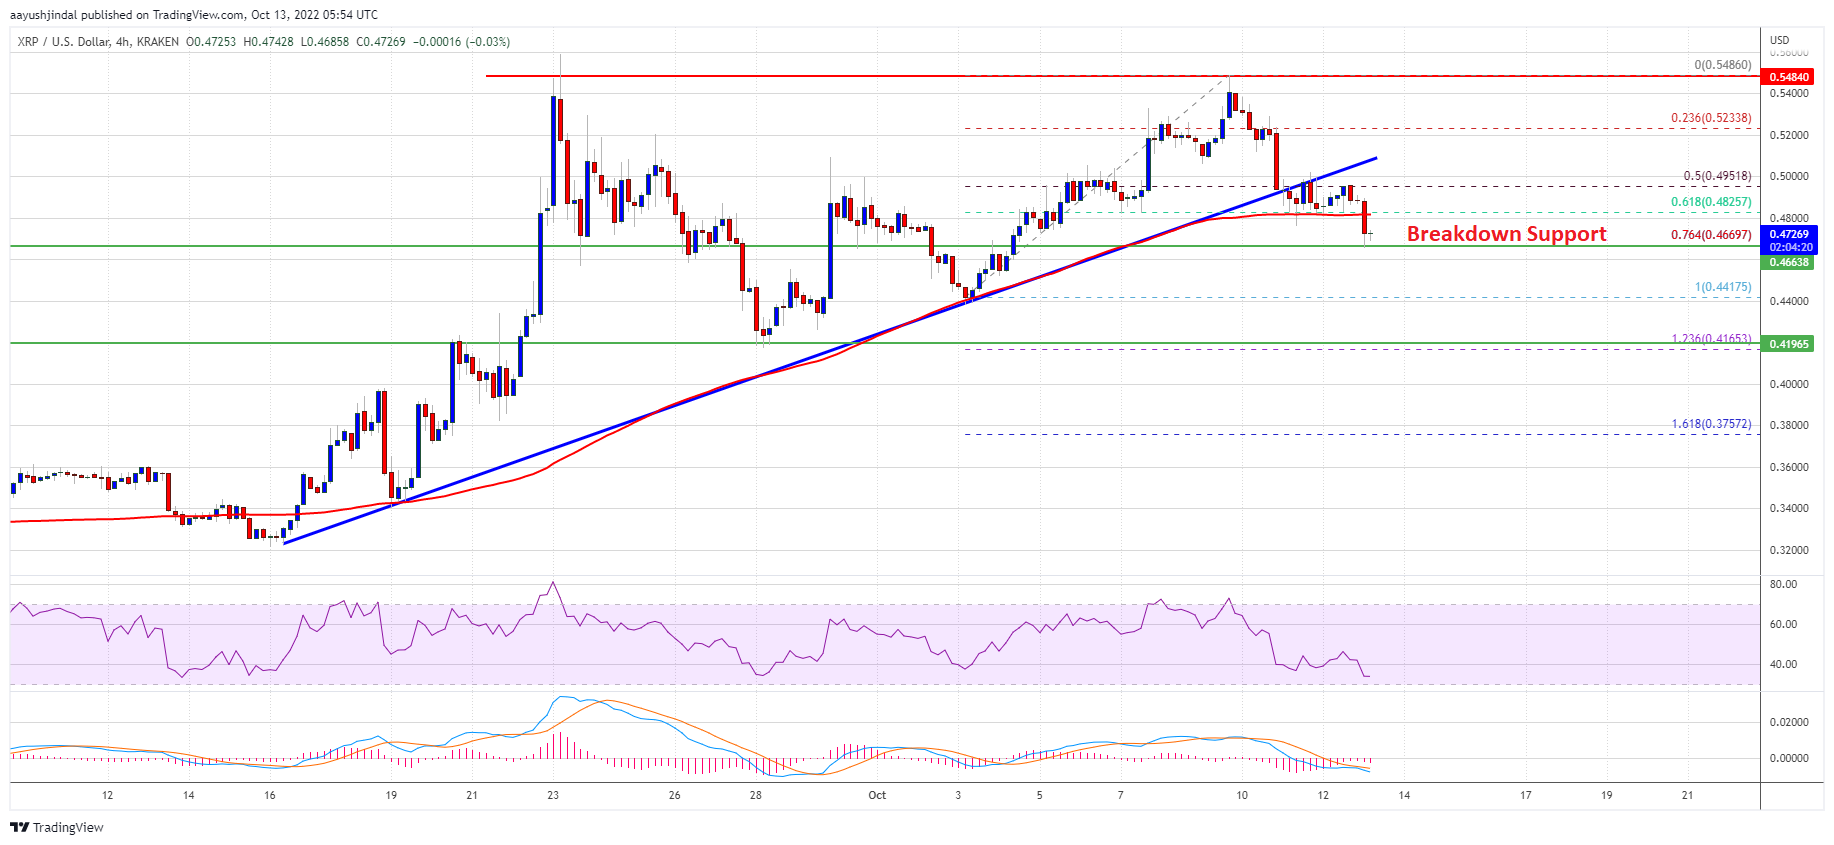
Source: XRPUSD on TradingView.com
On the upside, the price is facing resistance near the $0.4825 level. The first major resistance is near the $0.500 zone. A successful break above the $0.50 and $0.505 resistance levels could spark another rally. The next key resistance is near the $0.520 level, above which the bulls are likely to aim a retest of the $0.55 barrier.
If ripple fails to start a fresh increase above the $0.50 level, it could continue to move down. An initial support on the downside is near the $0.465 level. It is near the 61.8% Fib retracement level of the upward move from the $0.4417 swing low to $0.5486 high.
If there is a downside break and close below the $0.465 level, xrp price could start a major decline. In the stated case, the price is likely to drop towards the $0.42 support.
Technical Indicators
4-Hours MACD – The MACD for XRP/USD is now gaining pace in the bearish zone.
4-Hours RSI (Relative Strength Index) – The RSI for XRP/USD is now below the 50 level.
Major Support Levels – $0.465, $0.42 and $0.405.
Major Resistance Levels – $0.485, $0.505 and $0.550.
Previous article


Copyright © 2021-2024 AssessCrypto All rights reserved.