According to recent news reports, Tron (TRX) outperformed both Bitcoin and Ethereum in terms of energy efficiency.
Compared to Bitcoin, Tron uses 99.9% less energy (just 162,868 kWh). Being a major issue in the most recent session, crypto mining has been welcome publicity for Tron.
The Tron DAO recently tweeted a link to a blog post where they provided an update on some of their on-chain metrics and informed their followers of the exciting development.
Apparently, the number of accounts added has increased, and that Tron’s height has surpassed 43.61 million. Tron added over 971880 accounts this week, according to the blog post.
According to CoinMarketCap, TRX price has nosedived by 2.97% or trading at $0.06347 as of press time.
The TRON coin appears to be expanding quickly, as seen by a jump in transactions and TVL. Although there have been sporadic surges, its social dominance metric has remained stable.
It’s not all sunshine and roses for TRX, despite the fact that things are looking up on the social media front.
Since May, there has been a declining trend in both volume and market capitalization. In addition, Tron’s volume metric has experienced extreme fluctuation.
The level of development activity has likewise dropped by an unheard-of amount. This might be a sign that the Tron technology is not likely to see many breakthroughs or significant improvements anytime soon.
The advantages and disadvantages of Tron, however, seem to be in continual conflict with one another. On the micro-frame, however, the price hasn’t exhibited the same volatility.
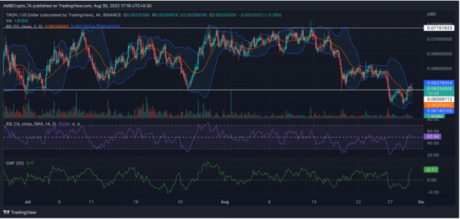
Chart from TradingView.com
TRX Future The $0.071 resistance and $0.063 support levels have mostly influenced TRX’s price action for a while now. In recent times, nonetheless, the price did surpass the $0.063 resistance level. Nevertheless, it has recovered.
The midline of the Bollinger Bands was being traded above by TRX on August 30. It may be interpreted as a bullish omen. It will be interesting to watch if TRX can overcome its immediate resistance and continue to rise.
Future price trends for TRX are shown by the weekly technical chart. Near $0.1, Tron’s upward momentum may come to a stop. The coin is currently supported at around $0.03. On the daily chart, the asset has been trading close to $0.069 with a loss of 2.07.
The price of the asset is presently trading below both the 50 and 100 Daily Moving Averages. New future highs are possible if the asset price crosses above the 100 DMA.


Copyright © 2021-2024 AssessCrypto All rights reserved.